This is an example of what a graph would look like 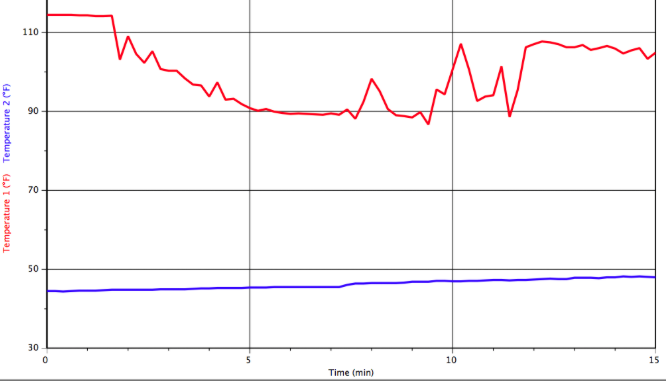 | 1. Over time the temperature of the cold water over time kept getting colder and colder but, eventually the cold water stopped decreasing and started to get warmer. The warm water started out very hot starting at about 117 degrees and then i realized that the cold water around the hot water condensed into the cup holding the hot water which made the hot water about the same degrees. 2. On the graph, there were lines representing "hot and cold". The lines started off apart, showing how different the temperatures were but then, the lines started converting together showing how the temperatures got closer together.k 3. I noticed that at the end of the experiment, the two lines representing their part of hot or cold, intersected each other. I think that this happened because at the end, the hot and cold became similar temperatures. 4. The cold water got colder by the hot water in the other cup. The heat in the cup transferred to the ice cold water to make it warmer. For the hot water to get cold, the same thing happened, the cold temperatures transferred to the hot water to make it colder. 5. The water did not go through the red solo cup, the heat did. I know this because I have done similar expirements like this and my old teacher taught us that. 6. The heat energy moved down because the ice water made it colder putting the heat energy downward. |
|
0 Comments
Leave a Reply. |
Archives
June 2015
AuthorWrite something about yourself. No need to be fancy, just an overview. Categories |
 RSS Feed
